Cybersphere
CyberSphere is an AI-powered cybersecurity monitoring and management system designed for enterprise-scale data centers and server infrastructures.The platform is built to synthesize massive, complex telemetry data into clear, actionable insights across server monitoring, threat detection, and historical analytics.
01
problem
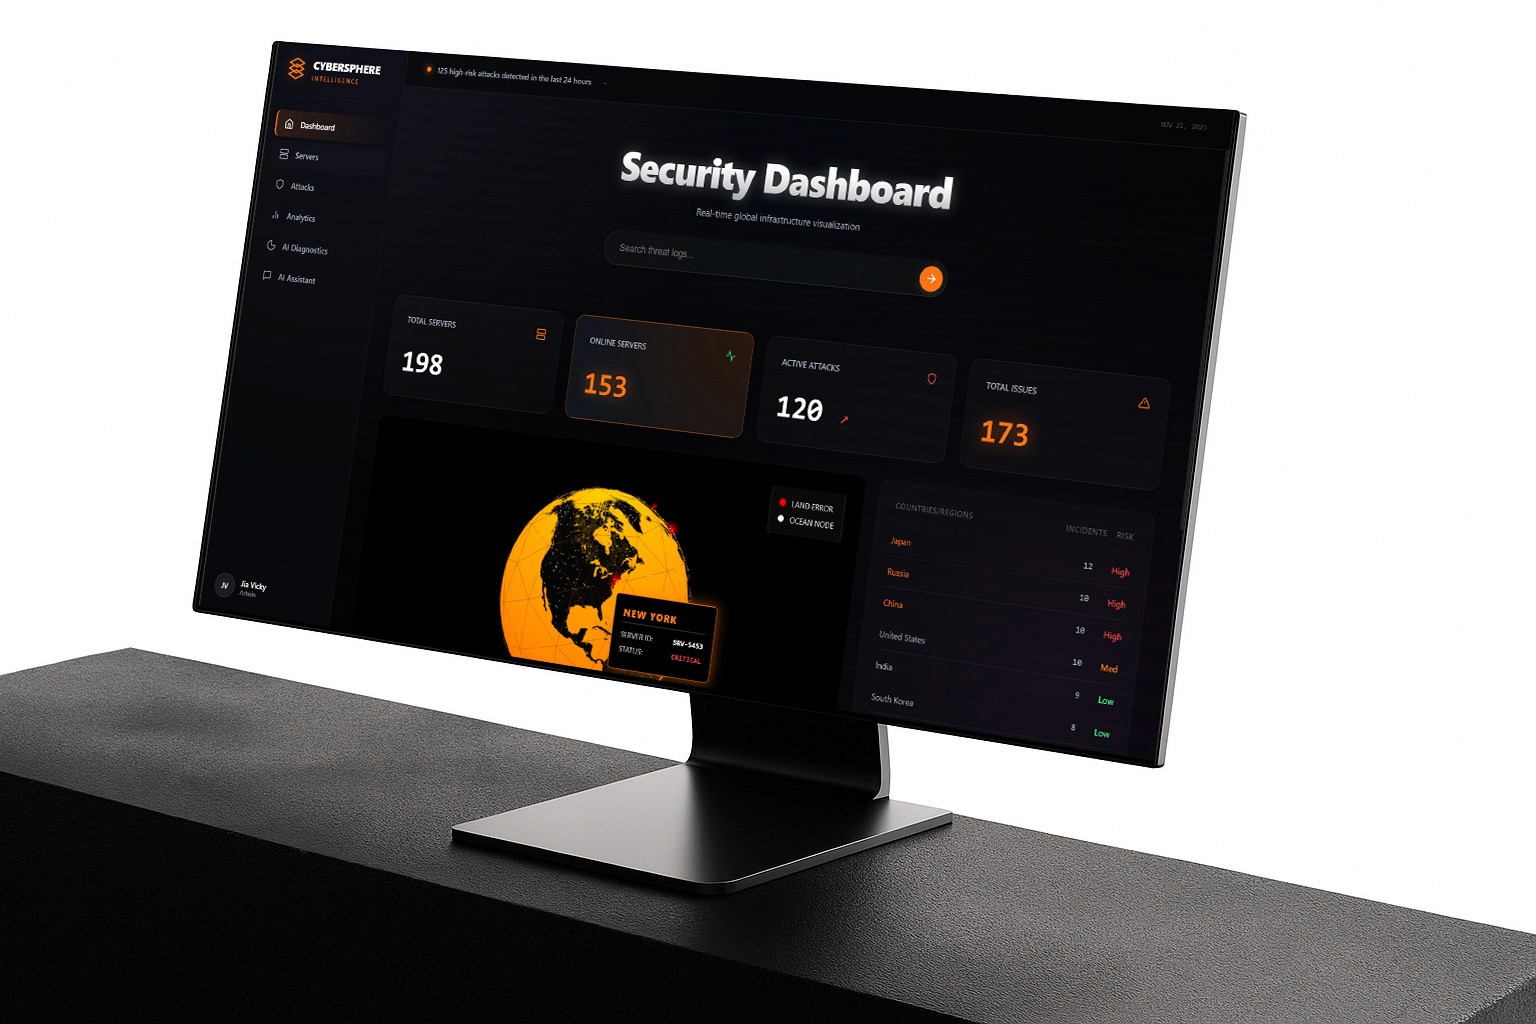
The security environment managed by "Cybersphere Intelligence" is currently facing severe operational stress and critical threats. Administrators are dealing with a high volume of active incidents, with alerts indicating "125 high-risk attacks detected in the last 24 hours" and a total of 173 ongoing issues. The extensive global infrastructure is showing signs of instability, with critical servers reported as "Damaged," "Busy," or "Offline" across different regions. Furthermore, security analysts must simultaneously track and mitigate diverse attack vectors—ranging from SQL injections to DDoS attempts—originating from multiple international sources.
solution
The application addresses these challenges by providing a centralized, high-fidelity security dashboard that synthesizes complex data into actionable insights. It offers real-time situational awareness through features like a live global threat map and immediate attack statistics. The design mitigates infrastructure management fatigue through visual server monitoring tools, including real-time load bars and a cluster health matrix. To handle the high threat volume efficiently, the system integrates advanced forensics like a live packet stream alongside AI-driven capabilities, offering automated diagnostic recommendations and a conversational AI assistant for rapid natural language data querying.
The Challenge
Cybersecurity analysts face an overwhelming amount of data daily. Traditional security dashboards are often cluttered, relying heavily on static tables and disjointed tools, which leads to "alert fatigue" and slower response times during critical attacks. The challenge was to design a unified, high-fidelity interface that visualizes complex server health and threat data in real-time, while integrating AI assistance to reduce cognitive load.
Key Features
Global Threat Visualization: A real-time, interactive world map and live packet stream that visualizes attack origins and targets instantly.
AI Diagnostics & Auto-Healing: An automated system that not only detects issues (e.g., "Resource Optimization") but suggests and executes fixes, displaying the status as "Pending" or "Executed."
Conversational AI Assistant: A built-in LLM interface allowing admins to query system status using natural language (e.g., "How many attack events occurred in the past week?").
Cluster Health Matrix: A visual grid system representing server status, allowing for quick identification of "damaged" or "offline" nodes without reading rows of text.
Forensic Analytics: Deep-dive charts analyzing attack types (DDoS, SQL Injection) and severity levels with neon-styled data visualizations.
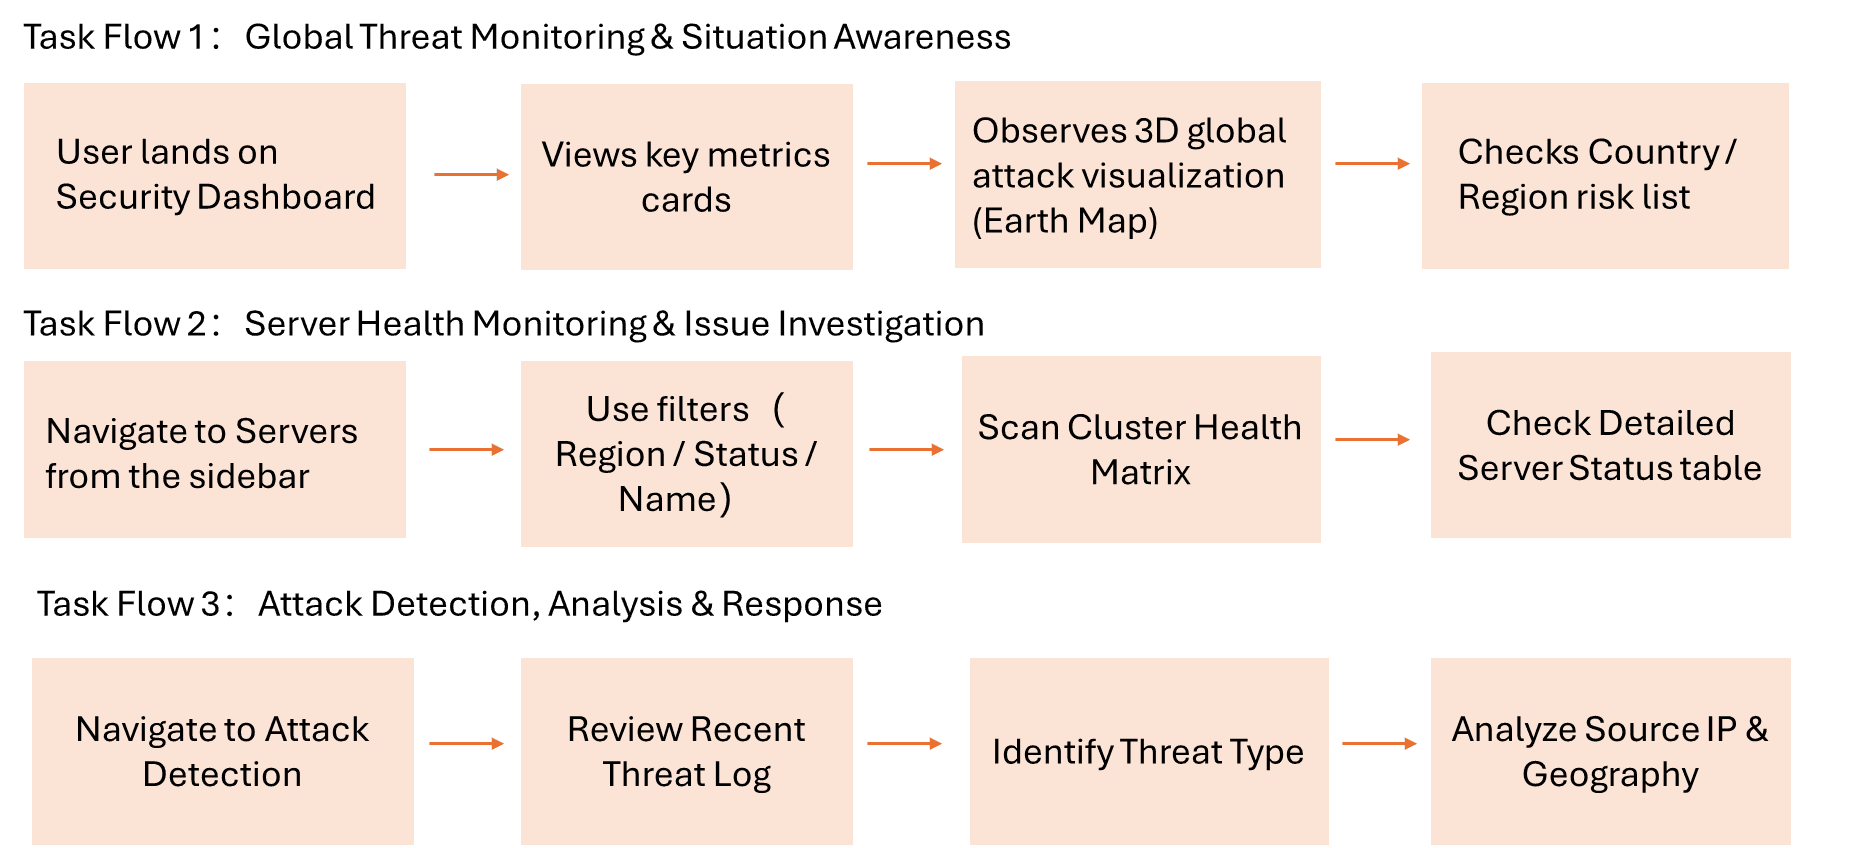
Task Flow
Usability Testing
improvements
Added tooltips and microcopy to clarify key metrics
Enhanced visual emphasis on critical risk states
Improved visibility and entry points for AI Diagnostics
Reduced initial information density without removing depth
User Feedback
"The pulse animation on the map is a changer. I don't have to hunt for the problem anymore; the interface literally signals me where to look." — Hong, Senior Analyst
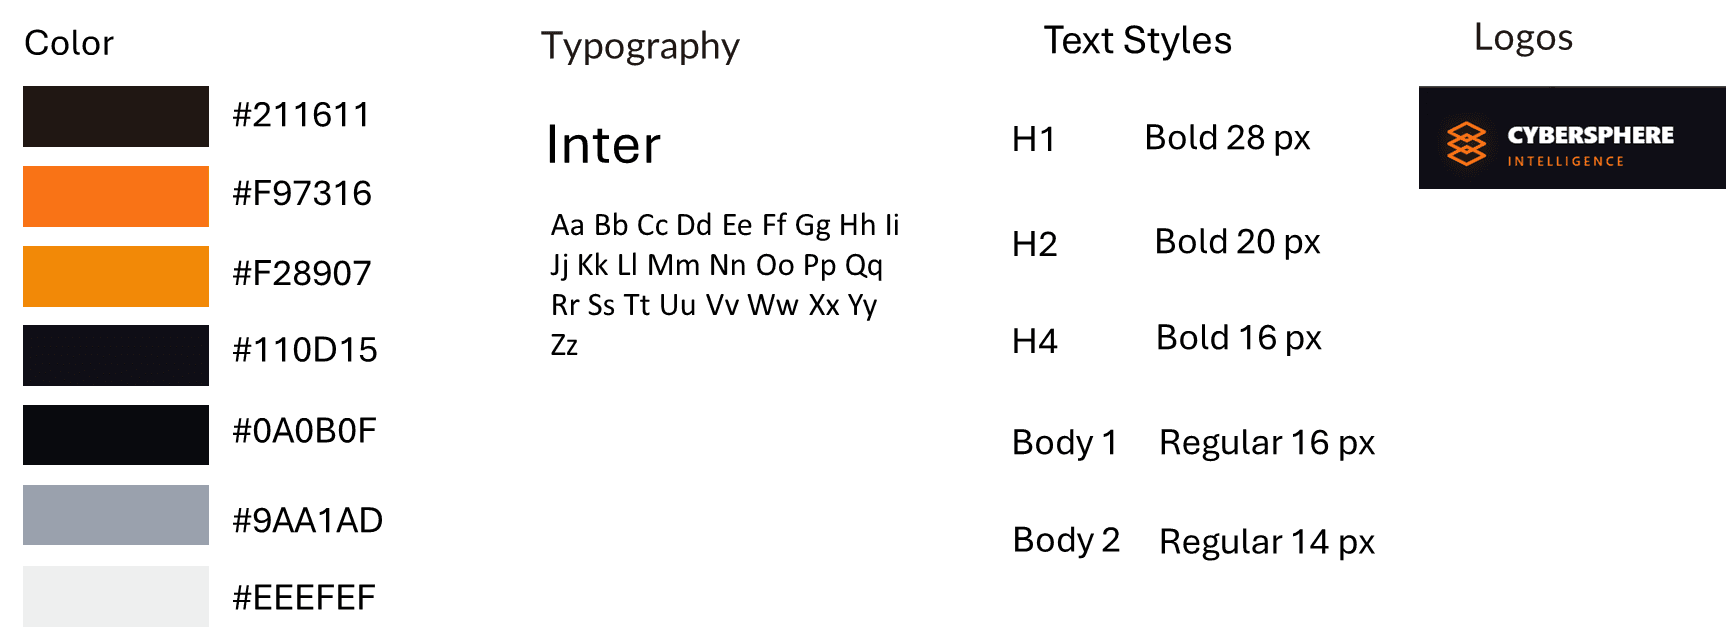
Design Style Guide
Features
Server Monitoring
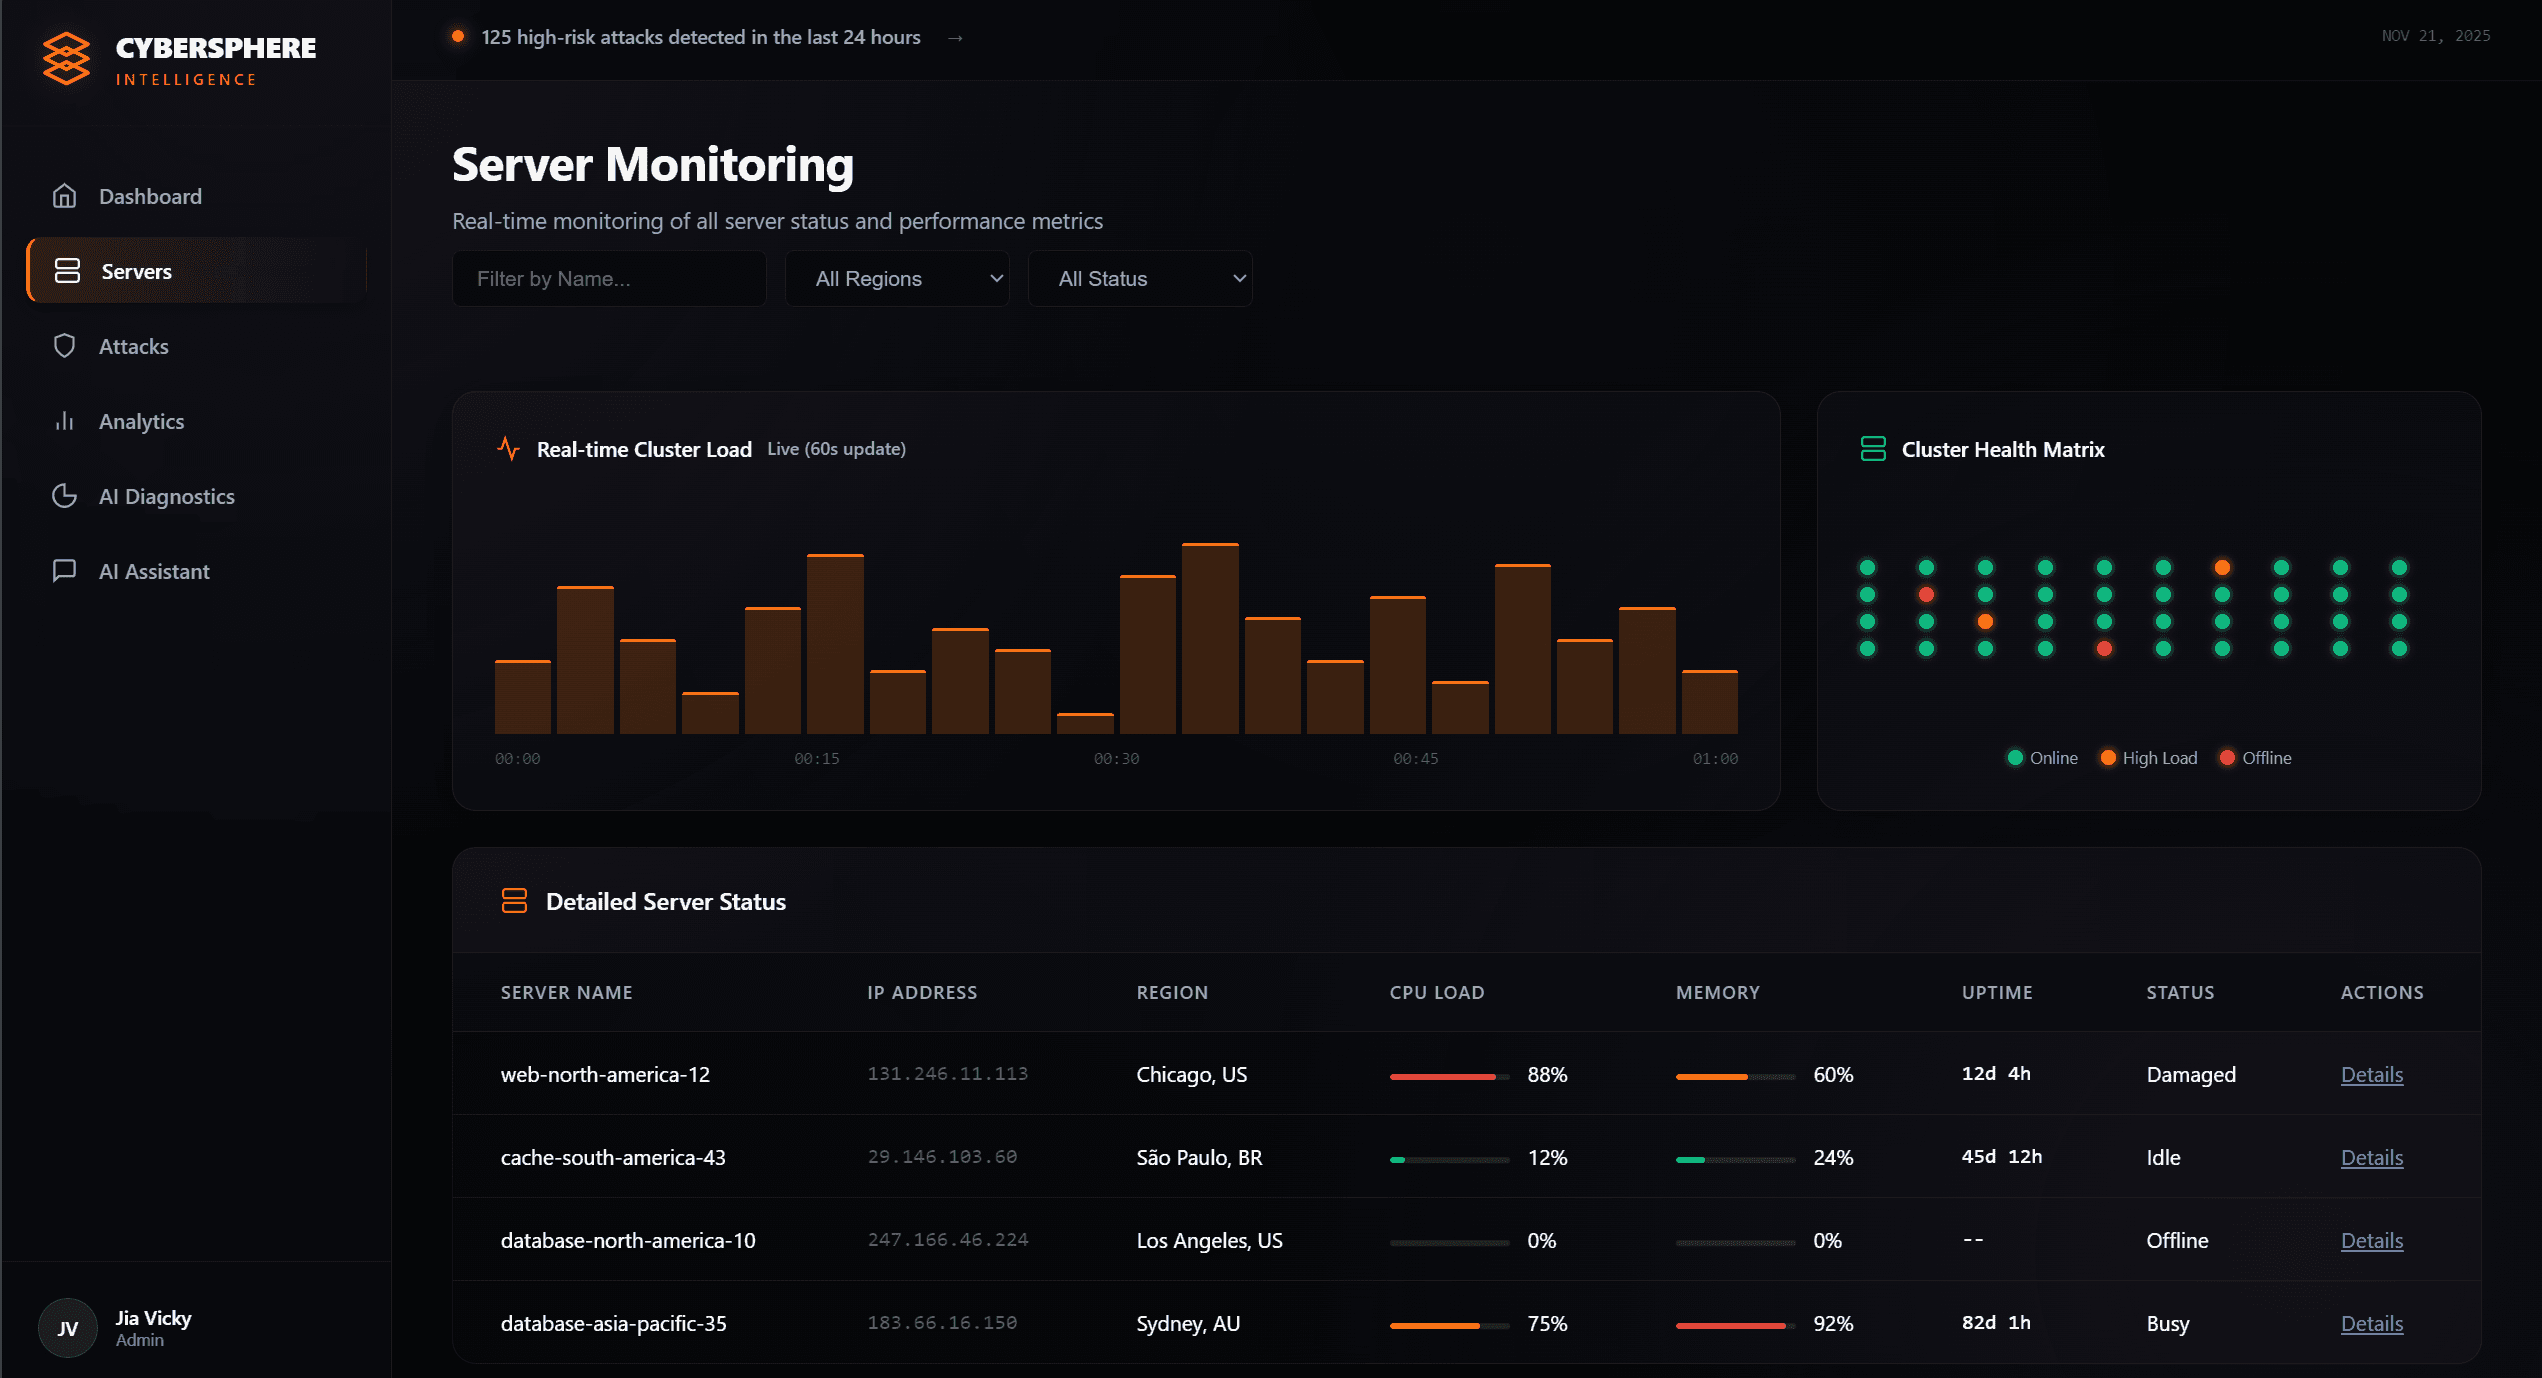
In the Server Monitoring view, my goal was to reduce the cognitive load required to track hundreds of active nodes.
Cluster Health Matrix: Instead of a long scrollable list, I designed a high-density dot matrix (right) that allows admins to identify "Offline" (Red) or "High Load" (Orange) servers instantly via peripheral vision.
Embedded Data Visualization: For the detailed table, I replaced standard raw numbers with linear progress bars for CPU and Memory usage, making resource consumption comparable at a glance.
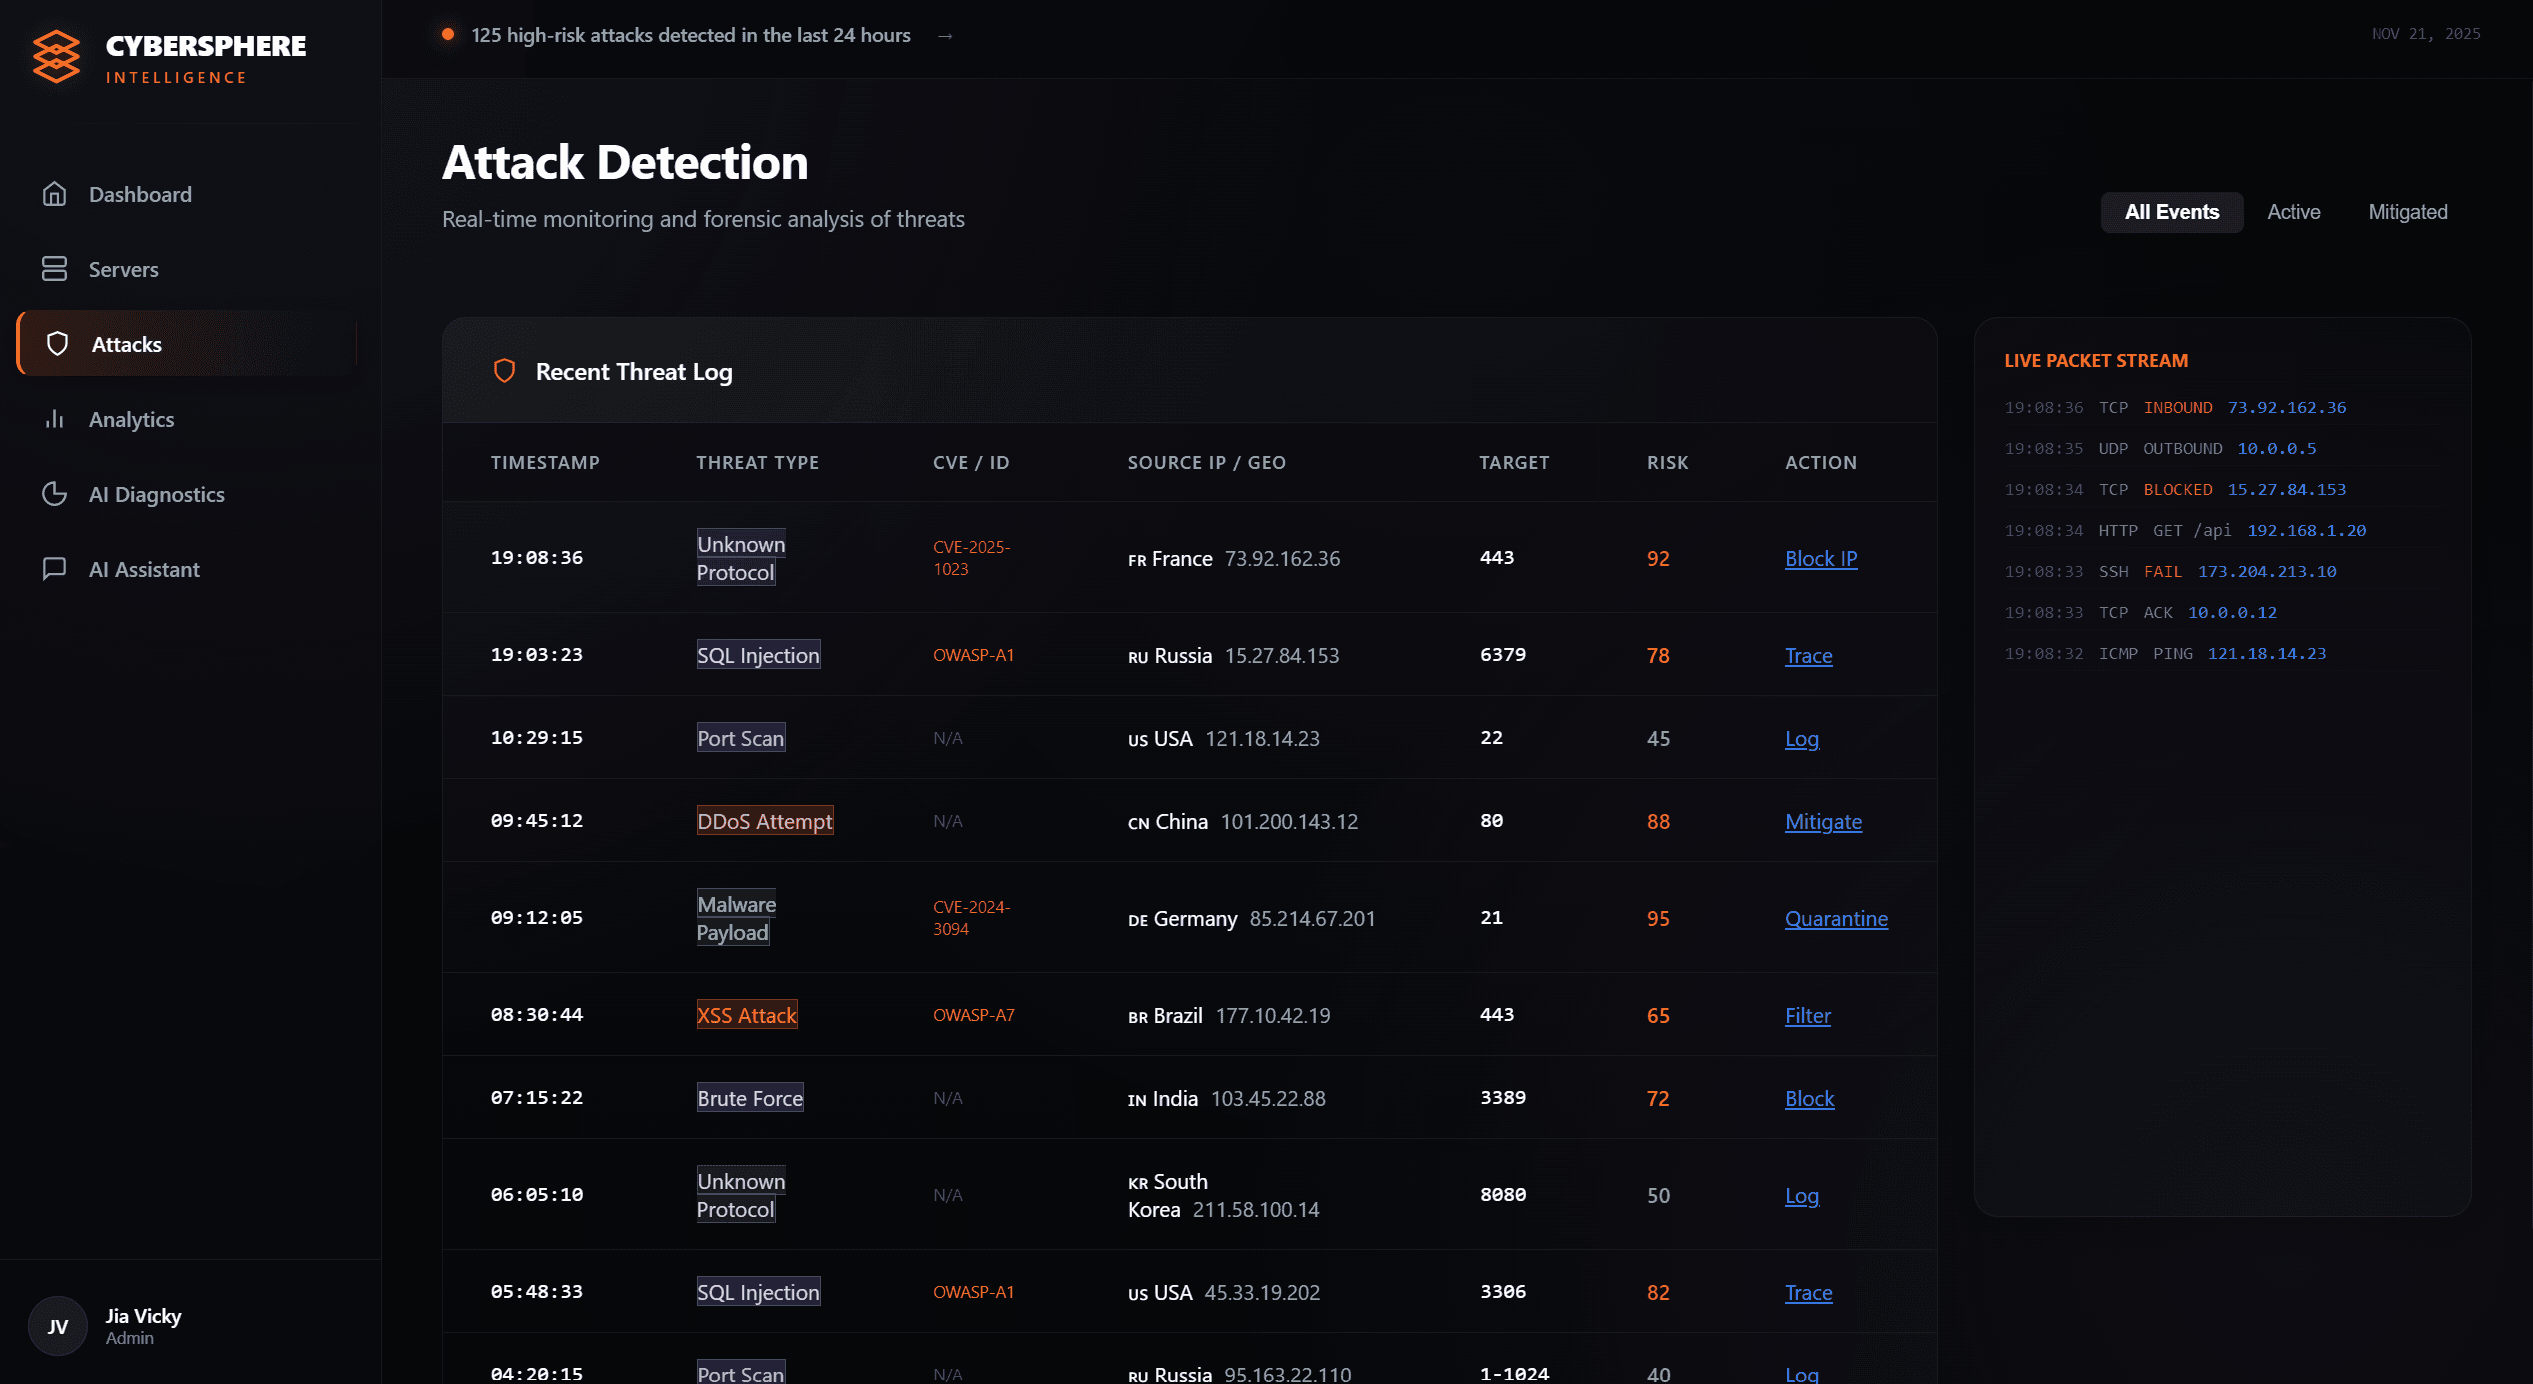
Attack Detection
Dual-View Layout: I combined a Recent Threat Log (center) for forensic analysis with a Live Packet Stream (sidebar) to give security analysts real-time context on active network traffic.
Risk Prioritization: To prevent alert fatigue, threats are auto-graded with a color-coded Risk Score (e.g., High-92), allowing analysts to focus on critical incidents first.
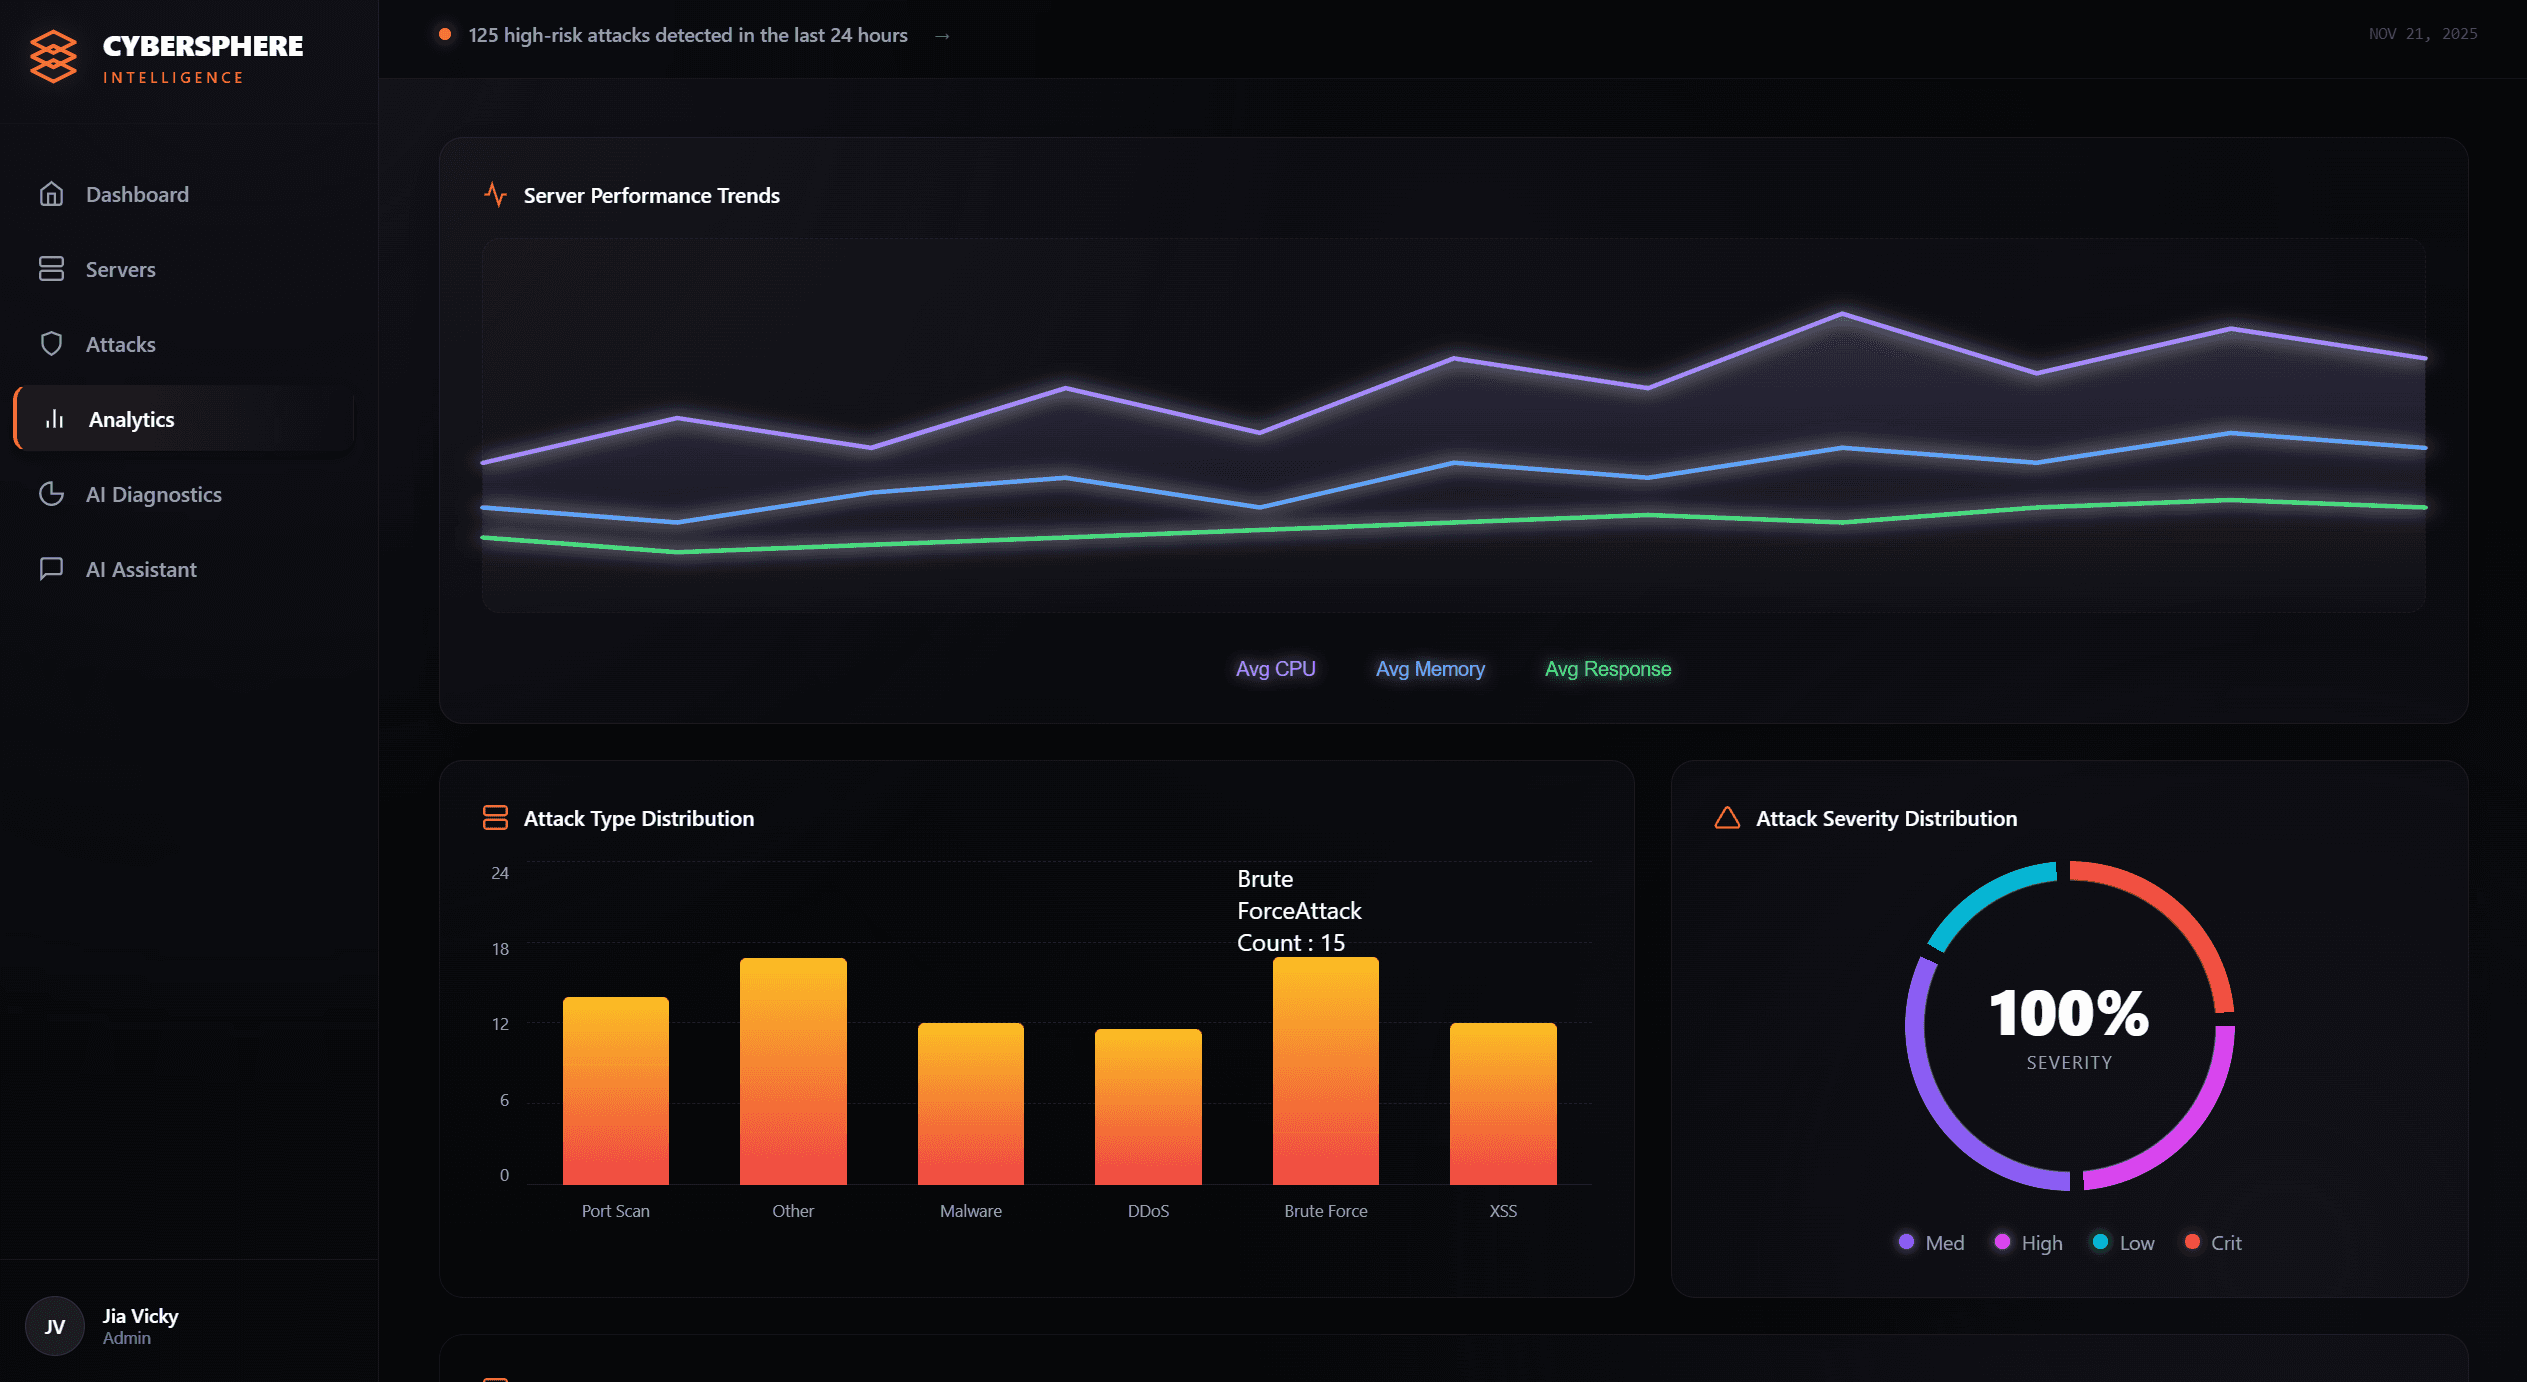
Analytics
The Analytics view transforms raw historical data into actionable patterns.
Performance Tracking: A multi-line area chart monitors server load and traffic stability over time to identify usage anomalies.
Threat Categorization: A comparative bar chart breaks down attack vectors (e.g., Malware, DDoS, Brute Force), highlighting the most frequent threats.
Severity Overview: A prominent donut chart visualizes the overall risk profile, categorizing incidents by severity (Low to Critical).
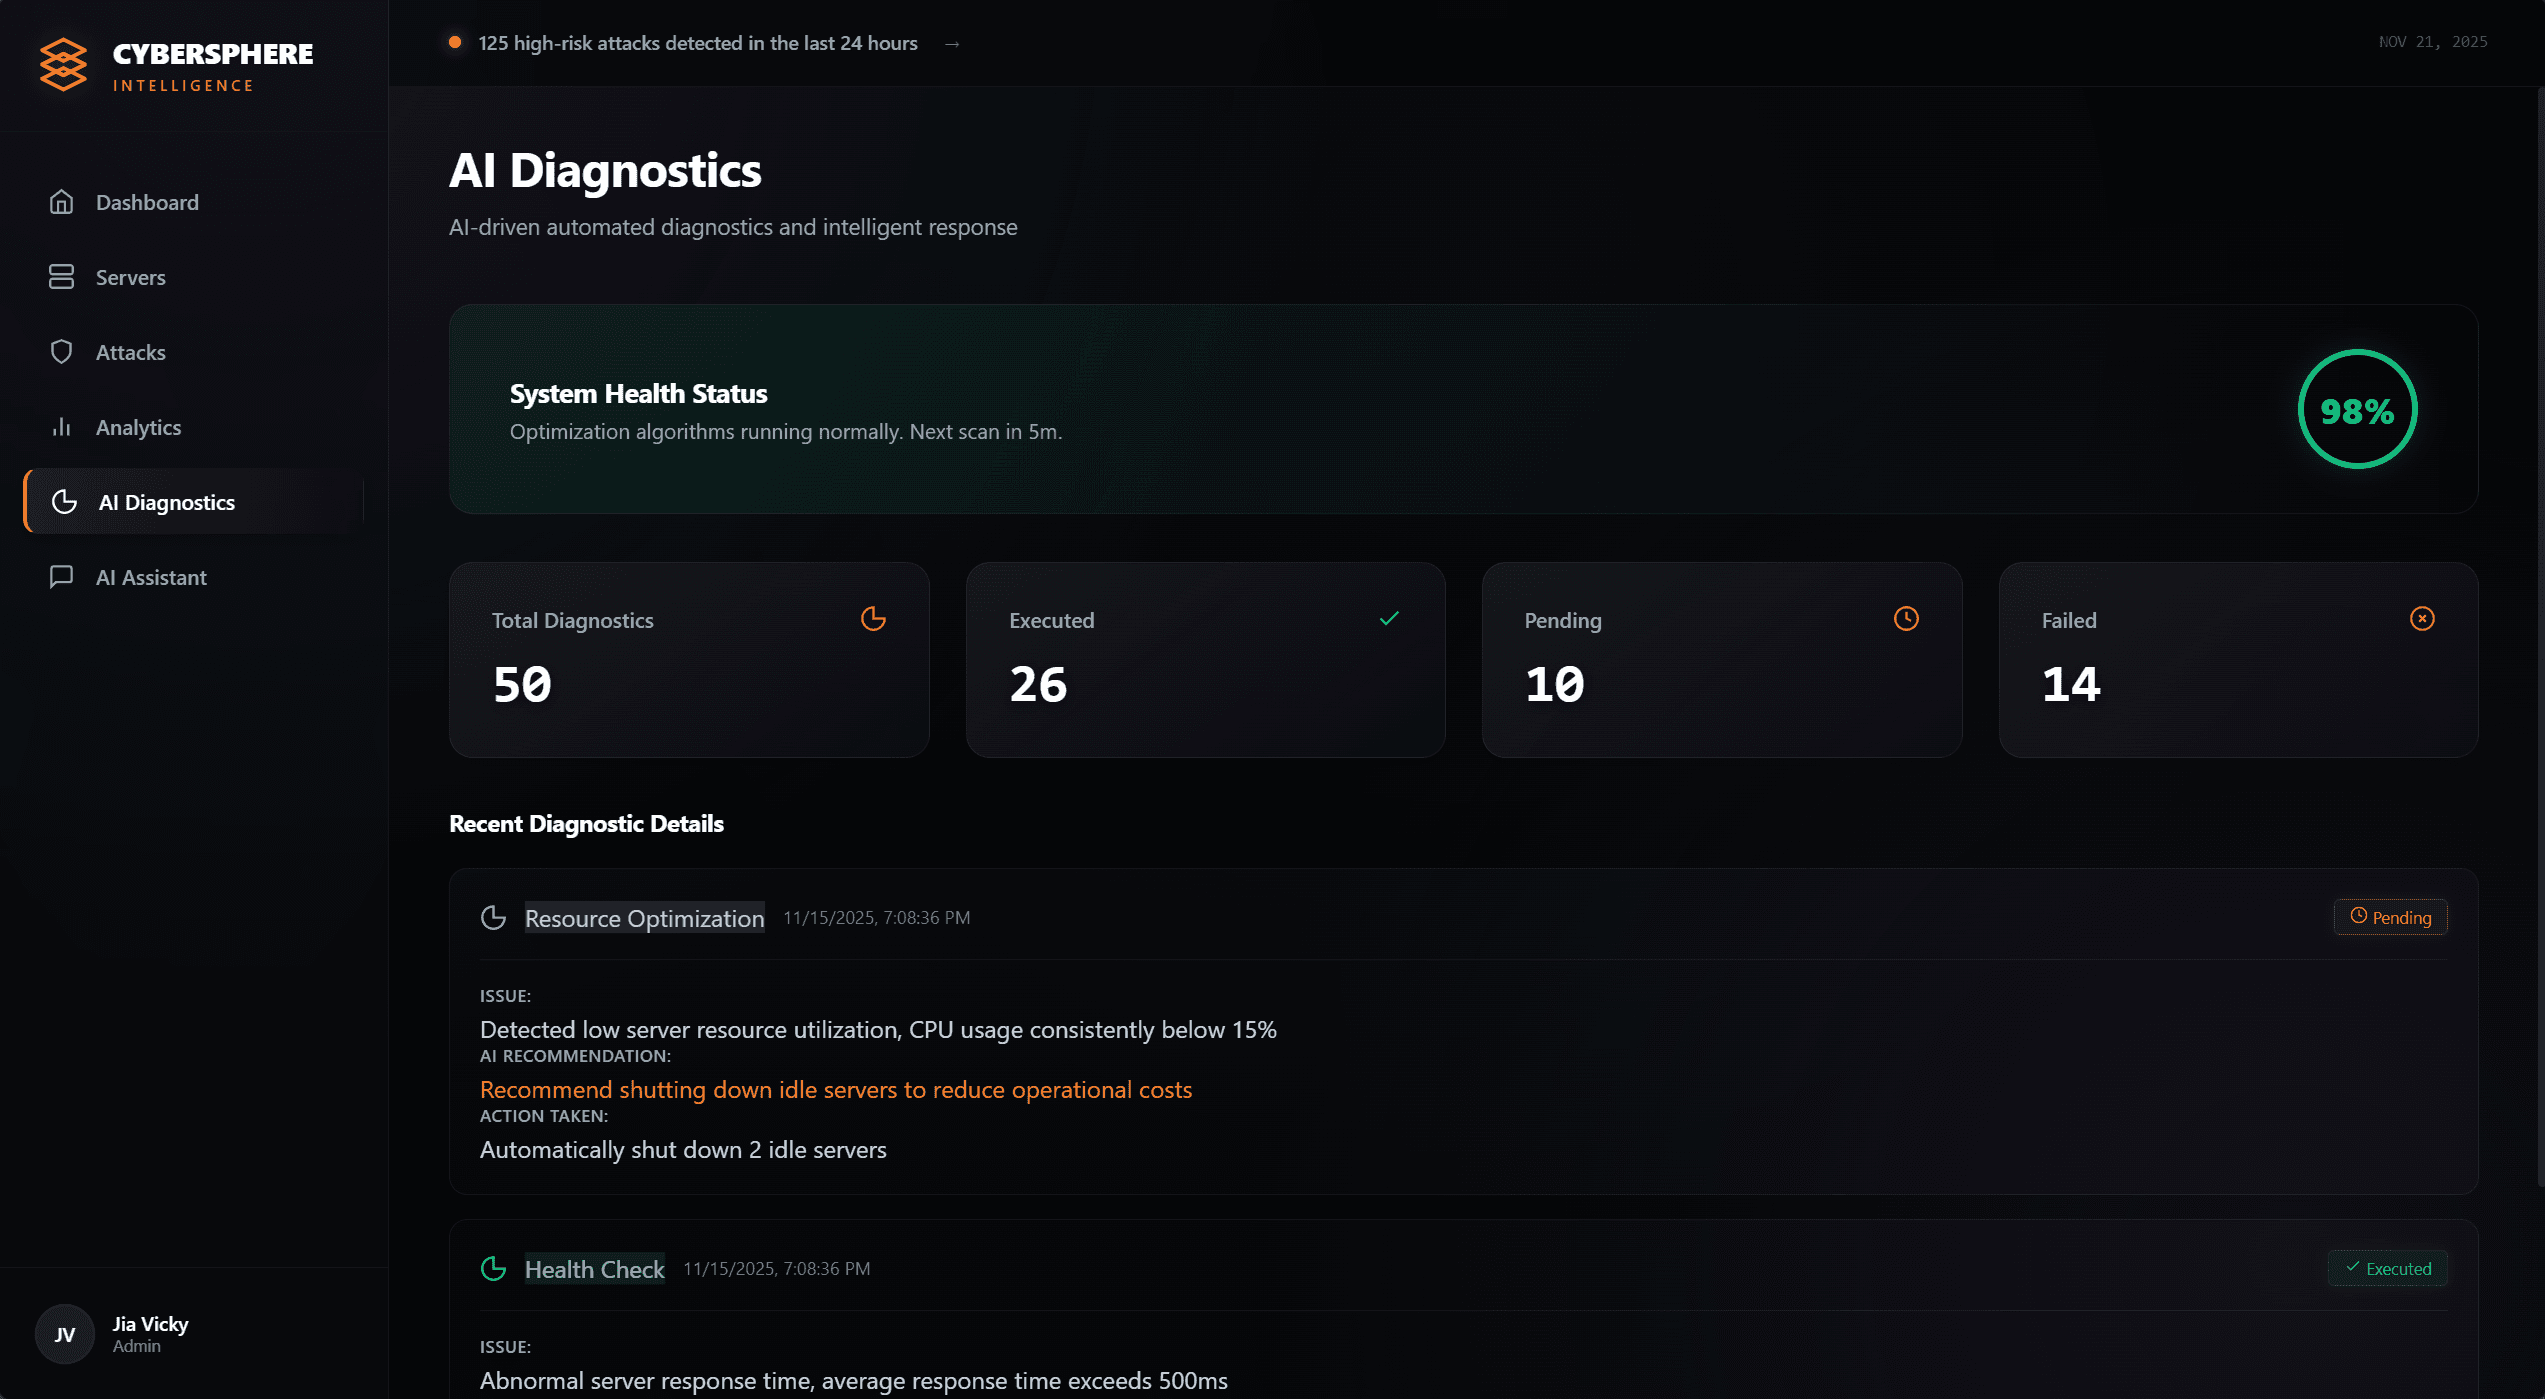
AI Diagnostics
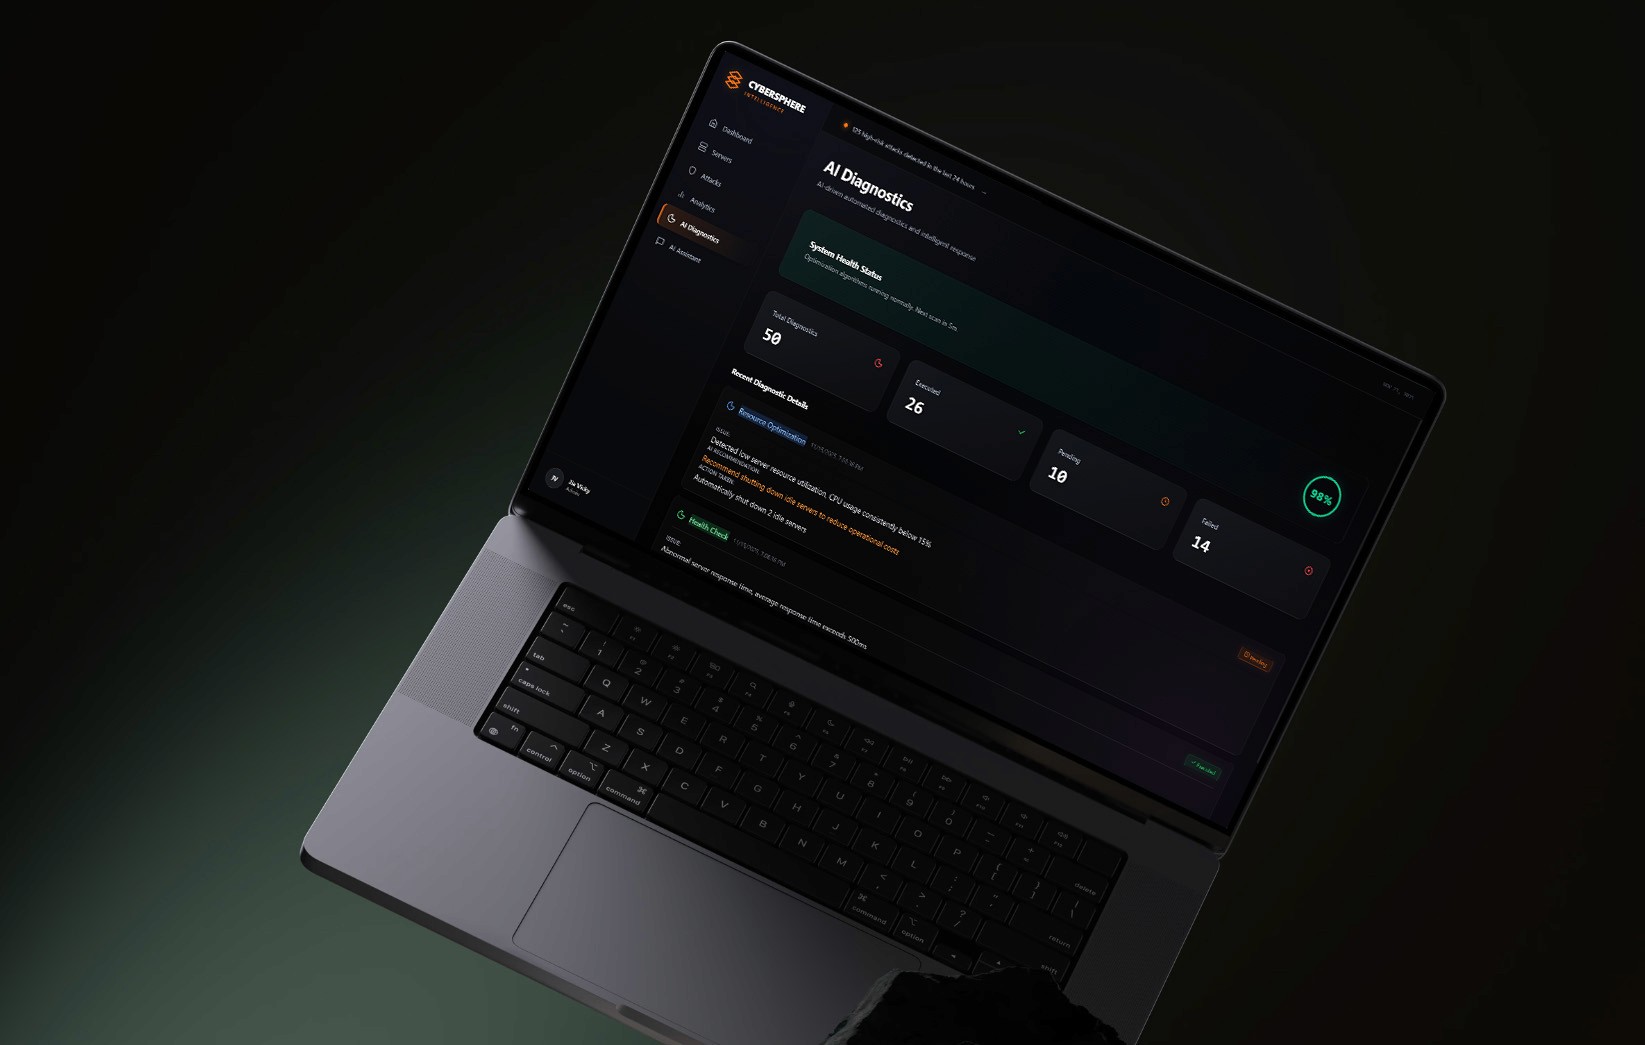
Instead of performing actions silently, I designed the diagnostic cards to clearly articulate the "Logic Chain": Issue Detected → AI Recommendation → Action Taken. This transparency helps admins understand and trust the automated decisions.The prominent System Health Score (98%) provides immediate emotional reassurance, while the distinct status breakdown (Executed/Pending/Failed) gives a clear operational overview.A summary row tracks the volume of automated tasks (e.g., 50 Total Diagnostics, 26 Executed), quantifying the AI's impact on workload reduction.
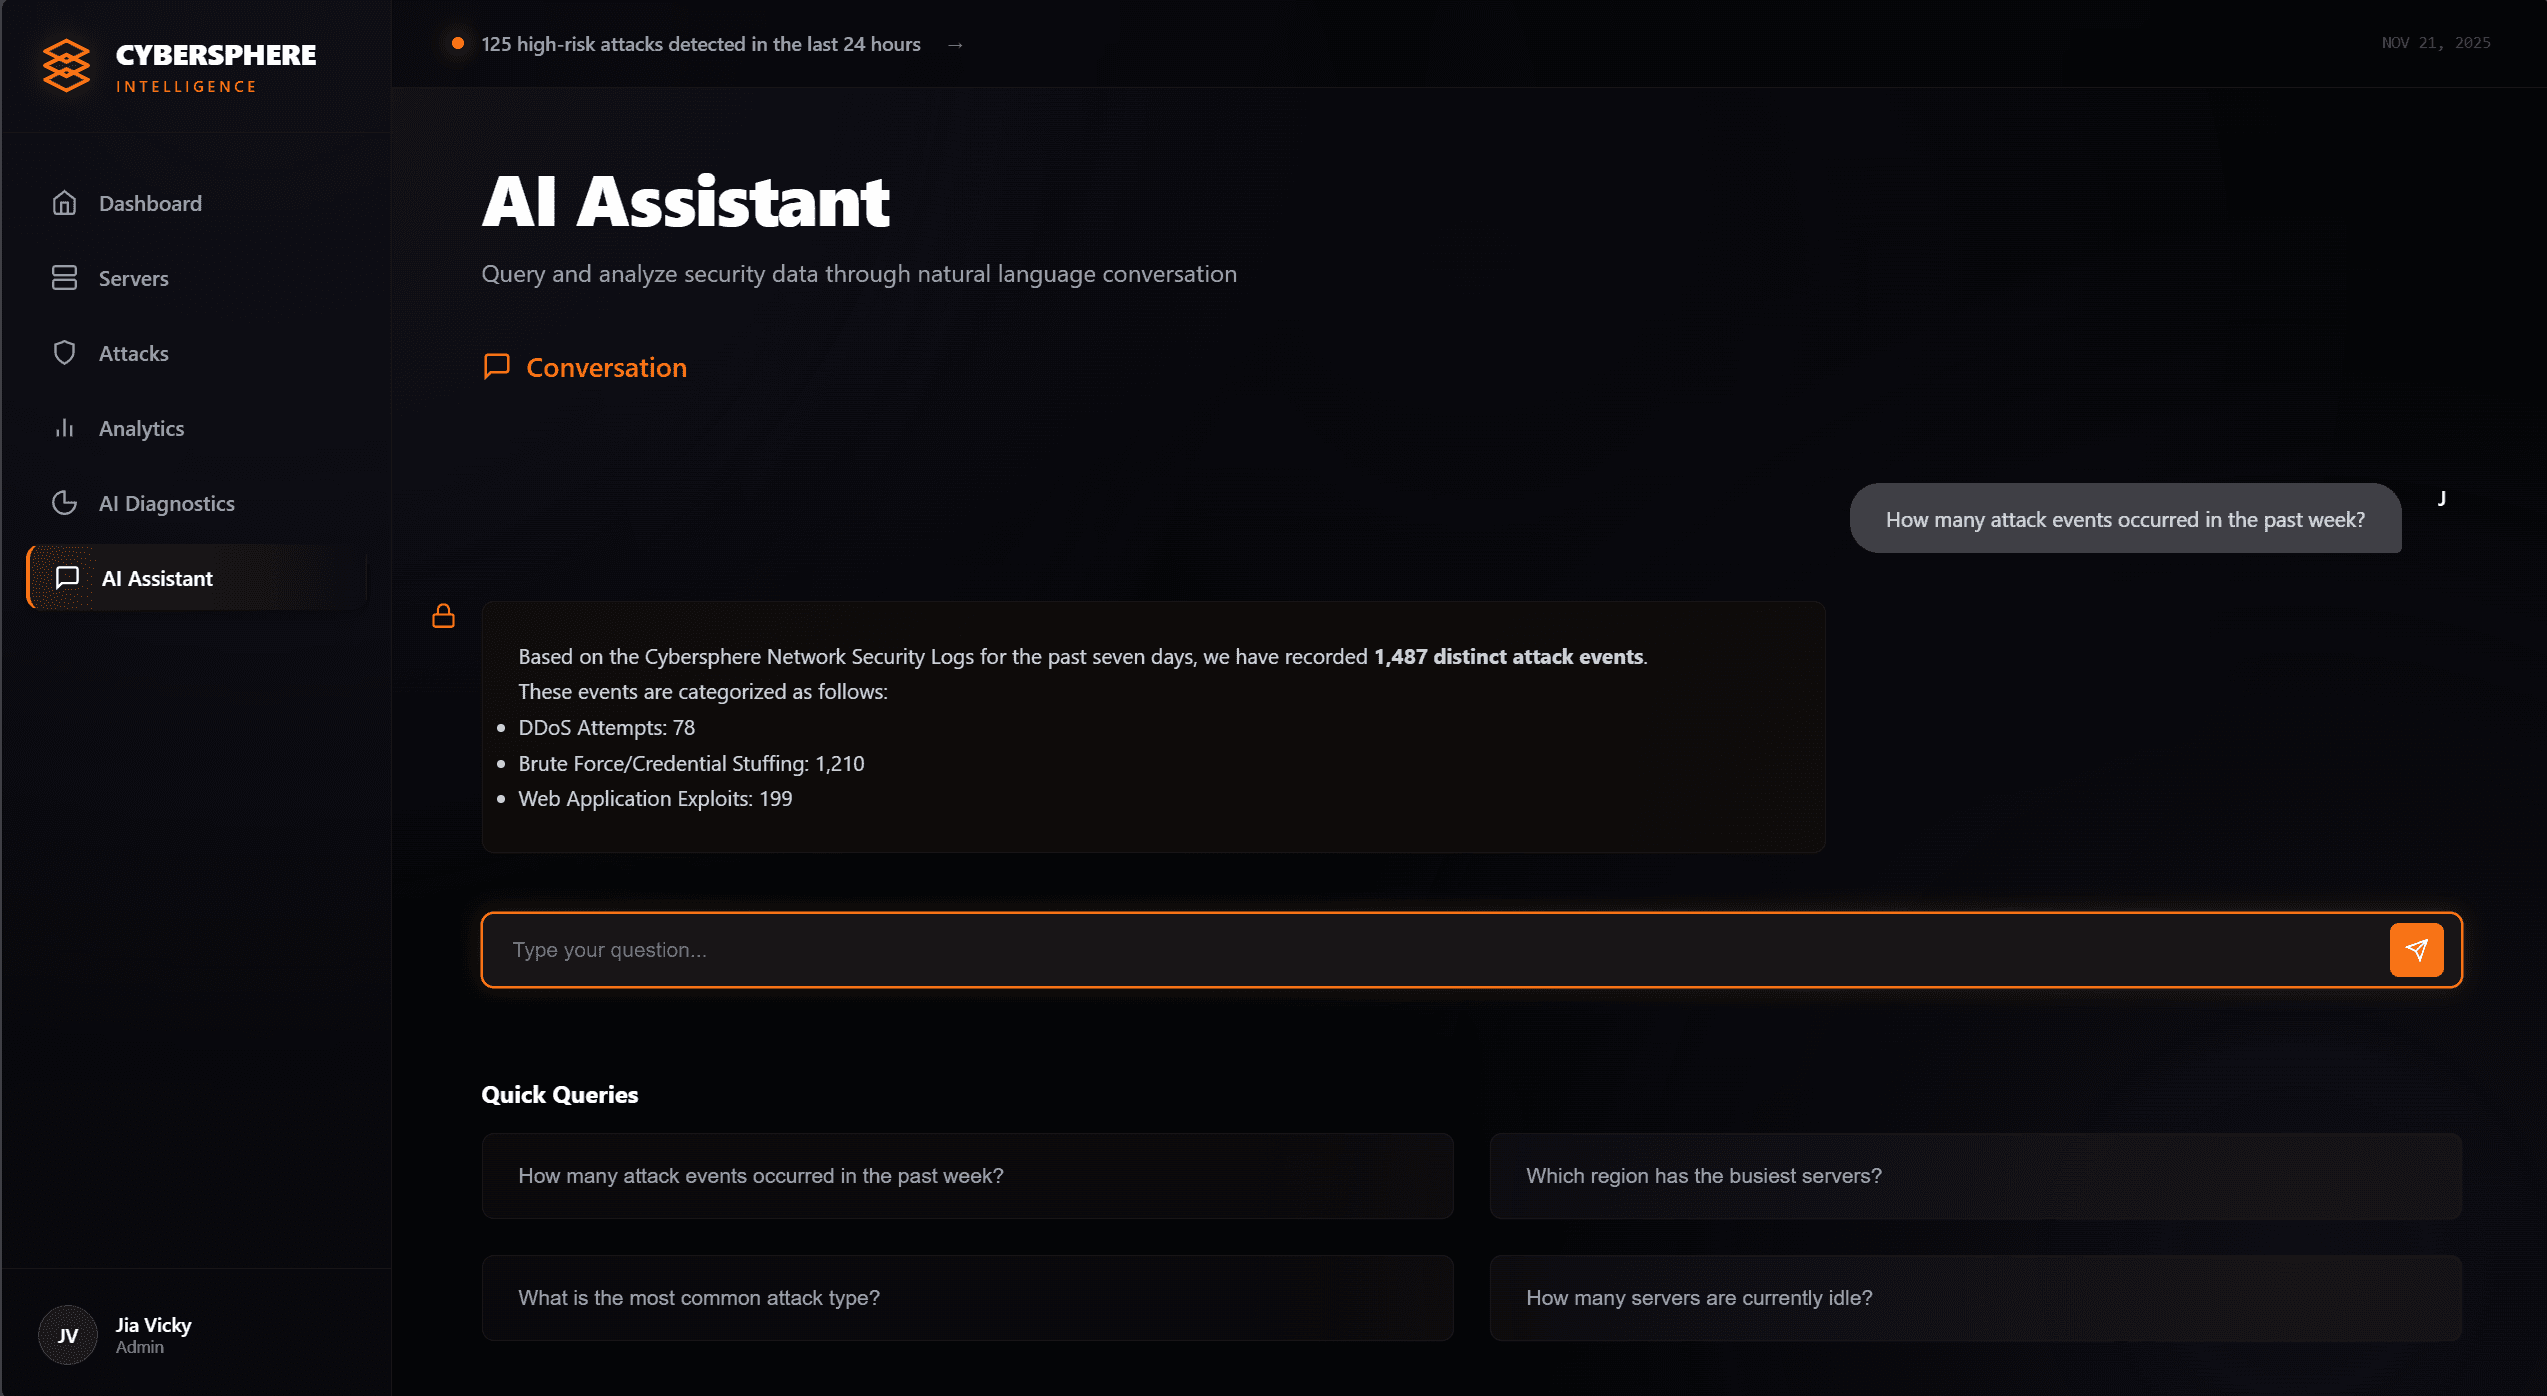
AI Assistant
Instant Log Summarization: The AI parses thousands of log entries to provide concise summaries, such as the breakdown of "1,487 distinct attack events" shown in the chat window.
Contextual Intelligence: The interface distinguishes between user queries and AI insights using clear visual hierarchy, ensuring critical data points (e.g., specific attack counts) stand out.
Smart Prompts: Integrated "Quick Queries" allow for immediate execution of routine security checks without typing.
Prototype
Cybersphere Prototype→
02
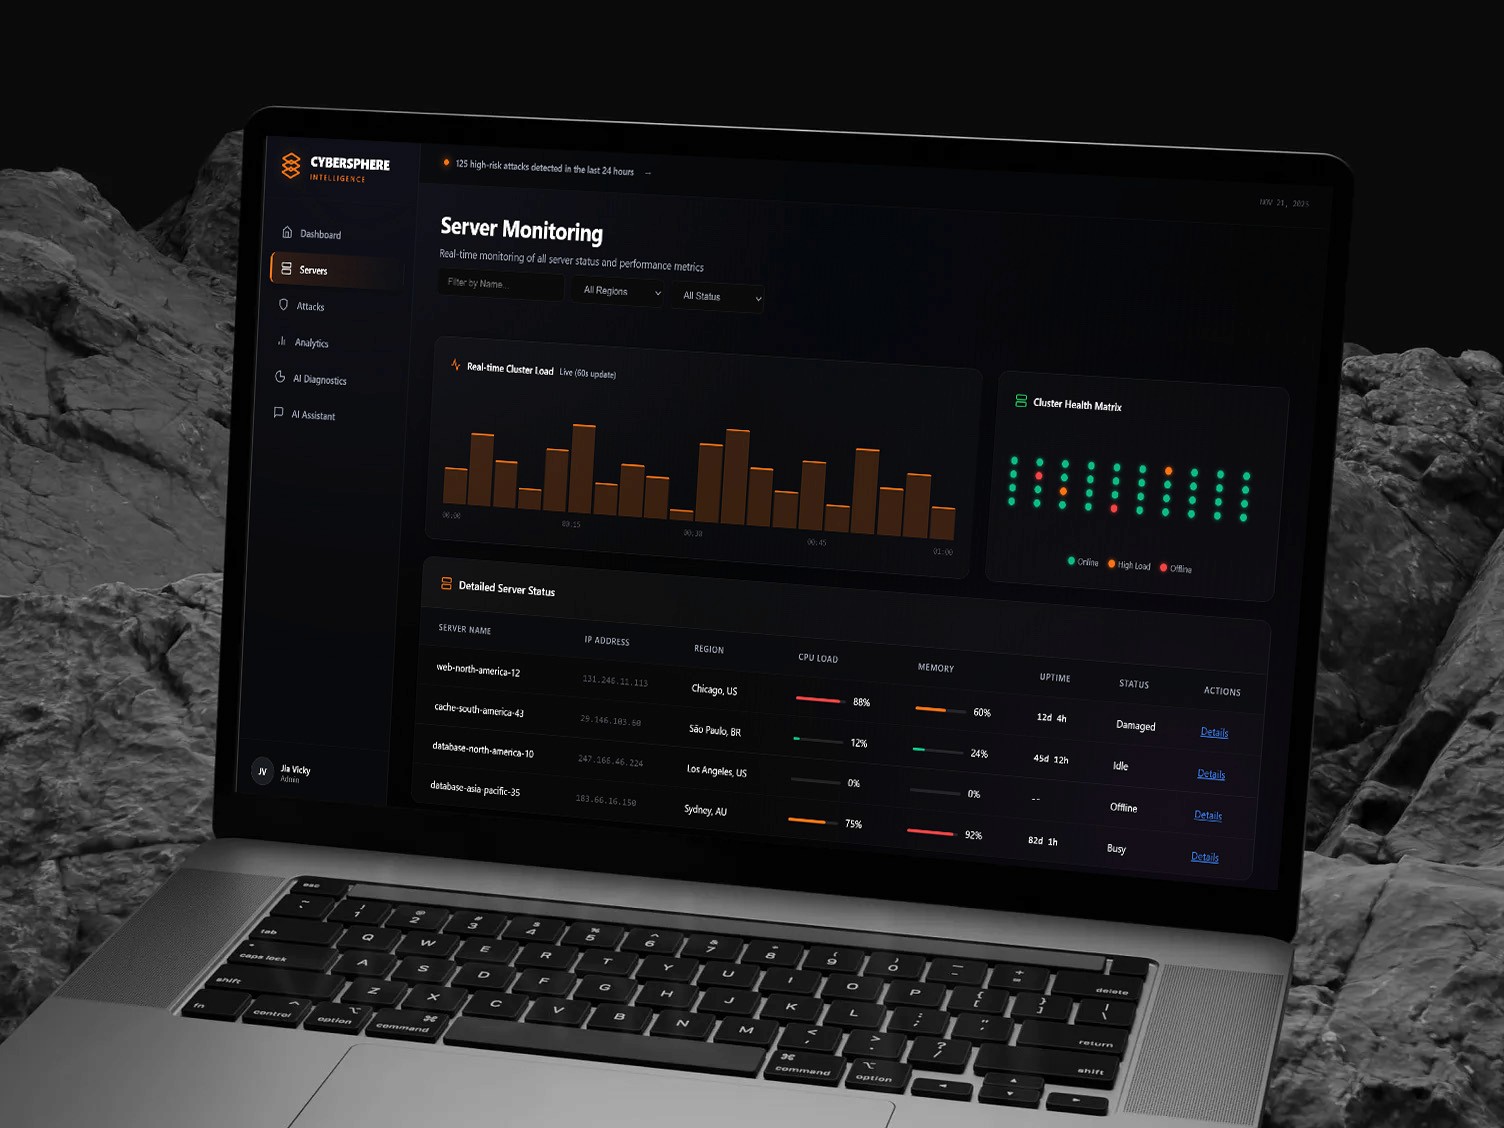
In the Server Monitoring view, my goal was to reduce the cognitive load required to track hundreds of active nodes.Cluster Health Matrix: Instead of a long scrollable list, I designed a high-density dot matrix (right) that allows admins to identify "Offline" (Red) or "High Load" (Orange) servers instantly via peripheral vision.Embedded Data Visualization: For the detailed table, I replaced standard raw numbers with linear progress bars for CPU and Memory usage, making resource consumption comparable at a glance.
see also